ROAS, MER and POAS all measure return on advertising, but they answer different questions. ROAS (return on ad spend) is the revenue an ad platform says it drove, divided by what you spent on that platform. MER (marketing efficiency ratio) is your total business revenue divided by your total marketing spend, across every channel. POAS (profit on ad spend) is the gross profit from ad-driven sales divided by ad spend. Use ROAS to optimise inside a platform, MER to judge whether your marketing as a whole is working, and POAS to make sure the sales you’re buying actually make money.
This guide explains each metric, shows a worked example where they disagree, and sets out when to use which.
The three formulas
| Metric | Formula | What it tells you |
|---|---|---|
| ROAS | Platform-attributed revenue ÷ platform ad spend | How a campaign or platform performs by its own measure |
| MER | Total revenue ÷ total marketing spend | How efficient your marketing is overall |
| POAS | Gross profit from attributed sales ÷ ad spend | Whether the sales you buy are profitable |
All three are usually written as a ratio (4x) or a number (4.0). For ROAS and MER, higher is better but “good” depends on your margins. For POAS, 1.0 is break-even, every pound of ad spend returns a pound of gross profit, so anything above 1 makes money before other costs.
ROAS: return on ad spend
ROAS is the number every ad platform reports. If Meta says your ads drove £20,000 of sales from £5,000 of spend, your Meta ROAS is 4x.
Use it for: day-to-day optimisation within a platform, comparing campaigns, ads and audiences against each other.
Watch out for: each platform only sees its own touchpoints and claims credit generously. Meta counts sales after someone clicked or viewed an ad; Google counts sales after someone clicked; both count the same customer. Retargeting and brand search look especially good because they reach people who were already going to buy. ROAS also ignores margin: a 4x ROAS can lose money if your margin is low. See what is a good ROAS?
MER: marketing efficiency ratio
MER ignores attribution entirely. It takes all the revenue your business made in a period and divides it by everything you spent on marketing in that period. If you made £120,000 and spent £30,000 across Google, Meta, TikTok and everything else, your MER is 4.0.
Use it for: judging whether your marketing as a whole is getting more or less efficient, setting overall budgets, and cutting through platforms double-counting the same sale.
Watch out for: MER includes sales that marketing didn’t drive, repeat customers, word of mouth, seasonality. It can’t tell you which channel is working; it tells you whether the total is. Many brands also track a new-customer version: new-customer revenue (or new customers) against marketing spend, which shows whether you’re actually growing.
POAS: profit on ad spend
POAS swaps revenue for gross profit: revenue minus the cost of the goods sold (and, if you like, shipping, payment fees and discounts). If ads drove £20,000 of sales at a 40% gross margin, that’s £8,000 of gross profit; on £5,000 of spend, POAS is 1.6.
Use it for: making sure campaigns chase profit, not just revenue, especially when margins differ a lot between products. Sending profit rather than revenue as your conversion value lets bidding favour profitable products.
Watch out for: POAS needs margin data by product, which takes work to set up, and it still relies on platform attribution, so it inherits ROAS’s over-counting.
A worked example: why they disagree
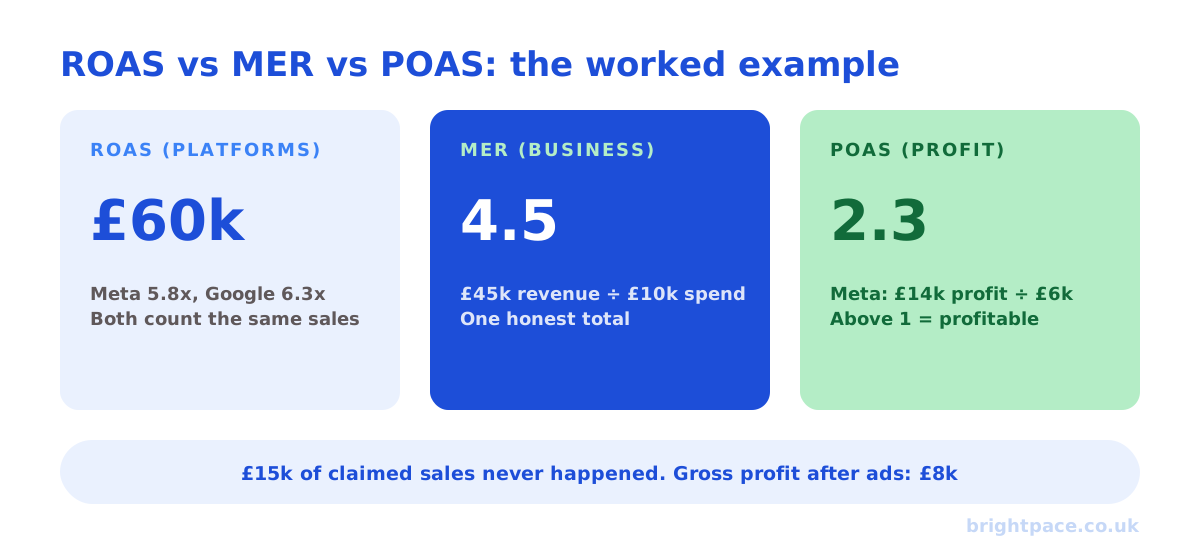
An online shop spends £10,000 in a month: £6,000 on Meta and £4,000 on Google. Its gross margin is 40%.
- Meta reports £35,000 of sales → Meta ROAS 5.8x
- Google reports £25,000 of sales → Google ROAS 6.3x
- Add them up and the platforms claim £60,000
But the shop’s own records show total revenue of £45,000 for the month. So:
- MER = £45,000 ÷ £10,000 = 4.5
- Meta’s POAS = (£35,000 × 40%) ÷ £6,000 = 2.3
- Business-level gross profit after ad spend = (£45,000 × 40%) − £10,000 = £8,000
Both platforms look excellent on ROAS, but together they claim £15,000 more revenue than the business made: that’s the double-counting. MER shows the true overall return, POAS shows that even Meta’s claimed sales are profitable after margin, and the profit line shows what’s actually left. Each number is “right”; they just answer different questions.
Which should you use?
Use all three, for different jobs:
- MER as your north star: set targets from it, and check it weekly. Our MER and POAS calculator works out yours, with your break-even. If MER is falling, something is wrong, whatever the platforms say.
- POAS (or margin-aware ROAS targets) for bidding: so the platforms optimise toward profitable sales. Work out your break-even with our ROAS calculator.
- Platform ROAS for in-platform decisions: which ad, audience or campaign to scale, compared like for like.
- Incrementality tests to settle arguments: when MER and ROAS disagree, a holdout or lift test shows what ads genuinely add. Try our incrementality calculator, or read how to run a lift test.
FAQs
What is a good MER?
It depends on your margins and how much of your revenue comes from repeat customers. Work back from profit: at a 40% gross margin, an MER of 2.5 means marketing roughly breaks even on gross profit, so you need more than that to grow profitably.
What is the difference between ROAS and POAS?
ROAS divides the revenue from your ads by what you spent; POAS divides the gross profit instead. So ROAS can look healthy while the sales lose money: a 4x ROAS on a 25% margin is a POAS of 1.0, which only breaks even. Check yours with our MER and POAS calculator.
Is POAS better than ROAS?
POAS is closer to what matters, because it measures profit rather than revenue. But it needs product-level margin data, and it still depends on platform attribution. Many brands use margin-aware ROAS targets as a practical middle ground.
Why is my MER lower than my ROAS?
Because each platform claims credit for the same sales, platform ROAS adds up to more revenue than you actually made. MER uses your real total revenue, so it’s usually lower, and more honest.
What does a POAS of 1 mean?
It means your ads returned exactly as much gross profit as they cost: break-even before other business costs. Above 1, ads are profitable on a gross-profit basis.
Should I report MER to my agency or board?
Yes. MER is easy to understand, hard to game and ties marketing to real revenue. Report it alongside new customers and profit, with platform ROAS as supporting detail. More terms are in our glossary.
In short
ROAS tells you how a platform rates itself, MER tells you how your marketing performs as a whole, and POAS tells you whether the sales you’re buying make money. Run your marketing on MER, bid on profit, use ROAS for in-platform decisions, and test incrementality when they disagree.
Sources
The platform documentation behind the attribution and profit reporting points. The worked examples are illustrative. Last checked October 2026.
- About attribution models and attribution settings, Meta Business Help Centre
- About data-driven attribution, Google Ads Help
- About conversions with cart data, Google Ads Help
- Cost of goods sold [cost_of_goods_sold], Google Merchant Center Help
Want reporting built on the numbers your business runs on? See our measurement service, or let’s chat.
Want a senior eye on your paid media strategy?
Work directly with the founder: no juniors, no hand-offs, 30-day rolling contracts.