On this page
Commercial alignment means judging paid media by its impact on the business, revenue, margin and growth, rather than by the metrics each platform happens to report. A campaign can post a brilliant ROAS or a rock-bottom CPA and still make the company less profitable. Channel metrics are a means; the P&L is the end.
This guide covers why platform metrics mislead, how to set targets from your own economics, how to measure what paid media really adds, and what commercially aligned reporting looks like in practice.
Channel metrics lie by omission
Every ad platform optimises toward, and reports on, its own version of success. That’s useful, but it’s a partial view:
- ROAS ignores margin. A 5x ROAS on a 15%-margin product loses money; a 2x on an 80%-margin product prints it. (Work out your real target with our ROAS calculator.)
- CPA ignores customer value. A “cheap” lead that never buys is expensive. A pricey one that becomes a repeat customer is a bargain. (Sanity-check yours with our CPA calculator.)
- Platform-reported conversions double-count. Google and Meta will both happily claim the same sale, each under its own attribution rules.
- Attributed isn’t the same as incremental. Some of the sales a platform claims would have happened anyway: branded search and retargeting are the usual suspects.
Optimise to any of these in isolation and you’ll make locally sensible decisions that are globally wrong.
Set targets from your own economics
Commercial alignment starts before a single campaign runs, by working out what you can actually afford to pay for a sale or a lead.
For eCommerce, start with gross margin. Say you sell a £100 product with a 40% gross margin: £40 of gross profit per order.
- Break-even ROAS is 1 ÷ margin = 2.5x. At that point the ad cost (£40) wipes out the whole gross profit.
- If you want to keep £15 of profit per order after advertising, you can spend at most £25 per order: a target ROAS of 4.0x.
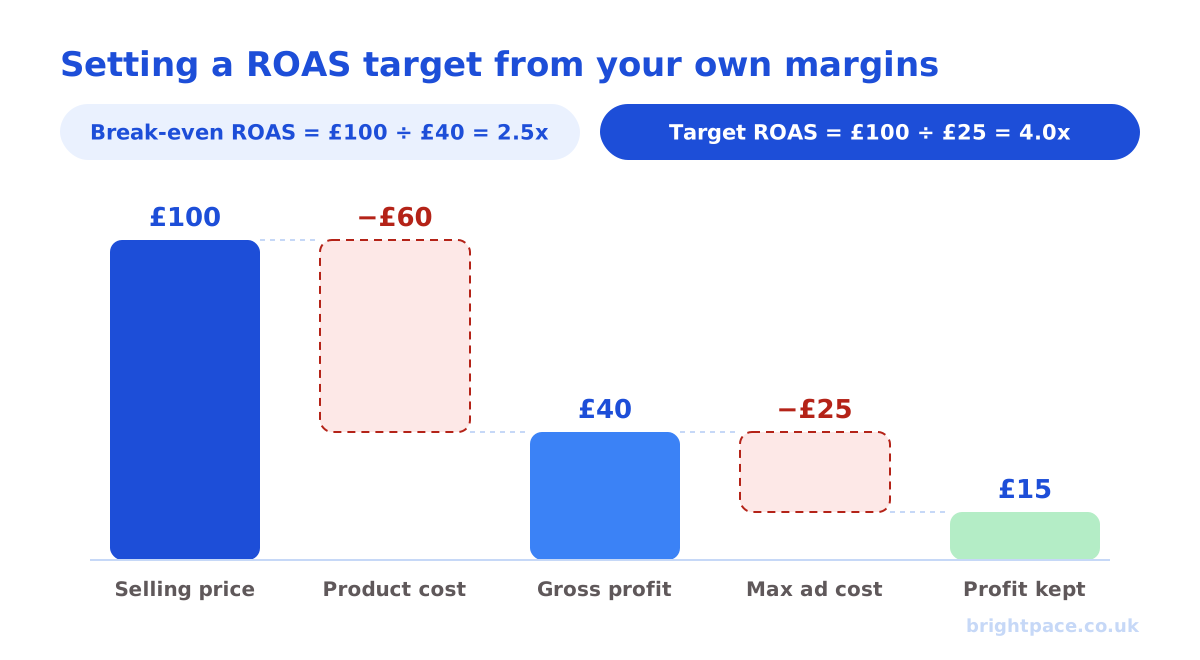
Same product, same platform, but the target now comes from the business, not from a benchmark someone quoted at a conference.
For lead generation, work back from the value of a customer: average deal value × gross margin × the share of leads that become customers. That gives you a break-even cost per lead, and your target CPA should sit comfortably below it. Our CPA calculator guide walks through a worked example.
Where customers repeat, first-purchase maths understates what you can pay. Factor in lifetime value, check your LTV:CAC ratio, but be honest about how long it takes to earn that value back, because cash flow is real even when LTV looks healthy.
Anchor every decision to the P&L
Once targets are grounded, connect each optimisation back to commercial reality:
- Feed true value into the platforms. Pass margin-weighted conversion values and, where you can, offline outcomes from your CRM, so the algorithms optimise toward profit and qualified pipeline, not form-fills. This is the foundation of structuring campaigns for automation.
- Judge blended, not siloed. Look at total new revenue, blended customer acquisition cost and marketing efficiency ratio (total revenue ÷ total marketing spend) across channels, not each dashboard alone.
- Separate new from returning customers. Paying full price to “acquire” people who already buy from you flatters every metric. Where platforms allow it, value or bid for new customers differently: your first-party data makes that possible.
- Bring in lifetime value. If customers repeat, first-purchase metrics will make you under-invest in acquisition.
Measure what paid media really adds
Attribution tells you who touched a sale; incrementality tells you whether advertising caused it. The two often disagree, and commercial decisions should lean on the second.
- Holdout and conversion lift tests. Meta and Google both offer lift studies that compare people who could see your ads with a group who couldn’t. Meta’s incremental attribution brings a modelled version of this into everyday optimisation.
- Geo tests. Switch spend off (or up) in comparable regions and compare sales against the rest of the country.
- Branded search checks. Test reducing brand spend where you rank strongly organically and competitors aren’t bidding, then watch total brand traffic, not just paid clicks.
- Blended trend analysis. When you add or cut a channel, does total revenue move? If platform-reported sales rise but the business doesn’t, you’ve found attribution, not growth.
None of these needs to be perfect to be useful. Even a rough incrementality read beats trusting every dashboard at face value.
Make the trade-offs deliberate
Efficiency and volume pull against each other: push for a higher ROAS and you’ll usually get less of it; chase volume and efficiency dips. Neither is “right”: the answer depends on your goals, margins, cash position and growth stage.
The job of good paid media isn’t to maximise a single metric. It’s to make that trade-off a conscious business decision, “we’ll accept a 3.5x to grow new customers faster this quarter”, rather than an accident of whatever bid strategy happens to be running.
A useful habit is to agree the trade-off in writing each quarter: the primary goal (profit, growth or a balance), the floor you won’t go below, and what you’ll do with extra budget if performance beats target.
What commercially aligned reporting looks like
Reporting shapes behaviour, so build it around the business:
- Lead with outcomes. Revenue, profit contribution, new customers or qualified pipeline, then explain the channel detail beneath.
- Show blended and platform numbers side by side, so the gap between claimed and real is visible.
- Compare against the targets you set from your economics, not last month’s platform benchmark.
- Say what you’ll do next. Every report should end with decisions: where budget moves, what’s being tested, what’s being cut.
Common signs of misalignment
- The agency celebrates ROAS while the finance team asks why profit hasn’t moved
- Targets haven’t changed in a year, even though prices, margins or costs have
- Branded search and retargeting take a growing share of budget and “perform” brilliantly
- Nobody can say what share of platform-reported sales are new customers
- Budget is split by channel habit rather than by where it earns most: the problem a unified media plan solves
Questions to ask your team or agency
- What is our break-even ROAS or CPA, and how was it calculated?
- How much of what we report is incremental, and how do we know?
- What share of conversions are new customers?
- Which conversion values are we passing to the platforms, and do they reflect margin?
- If you had 20% more budget tomorrow, where would it go, and why?
If the answers are vague, that’s where to start. A Google Ads account audit is a good way to check measurement and targets properly.
FAQs
What does commercial alignment mean in paid media?
Judging and managing ad spend on the numbers the business runs on, such as profit, new customers and payback, rather than on platform metrics like clicks, CTR or reported ROAS.
Why can a good ROAS still lose money?
ROAS ignores margin. A 5x ROAS on a product with a 15% margin loses money, while a 2x ROAS on an 80% margin product is very profitable. Set targets from your own margins.
How do I know what my ads really add?
Use lift tests or geo tests where you can, and watch blended results such as total sales, new customers and MER alongside what each platform reports.
In short
Channel metrics are inputs, not scoreboards. Set targets from your margins and customer value, feed true value back into the platforms, test what’s genuinely incremental, and make efficiency-versus-volume a deliberate choice. That’s the difference between a good-looking dashboard and a more profitable business.
Sources
The platform documentation behind the bidding, profit and measurement points. The worked examples are illustrative. Last checked October 2026.
- About Target CPA bidding, Google Ads Help
- About conversions with cart data, Google Ads Help
- About attribution models and attribution settings, Meta Business Help Centre
- About Conversion Lift, Google Ads Help
This commercial-first approach is the core of how we work. Explore our media management and consultancy, or let’s chat about your account.
Want a senior eye on your paid media strategy?
Work directly with the founder: no juniors, no hand-offs, 30-day rolling contracts.